Dashboard does not see any panels
 Updated
by
Tim Chimes
Updated
by
Tim Chimes
Scope
Upon starting Dashboard, you may notice that it cannot connect to your Infinity devices. We will walk through some possible causes and solutions to this.
Diagnosing the problem
This issue can appear in two different ways.
- A fresh install of Dashboard shows no devices, no I/O, and no connection to anything, even after sitting for an extended period of time
- Dashboard has already been connected to your devices, but you notice one or more device show a red exclamtion mark. The red exclamation mark that Dashboard has lost connection to that particular panel
How to discover devices when Dashboard is blank
If Dashboard shows nothing at all, that typically means that something is blocking network connectivity from Dashboard to the devices.
- Try pinging a device, or navigating to its web interface using its IP address (you can find this from the device's front panel). If you cannot reach the device, this is likely a network issue. Make sure that your Dashboard computer is on the same network as your Infinity devices.
- If you can ping the devices, check your firewall or antivirus. By default, Dashboard uses port 49352 to communicate with the panels, and it's possible that your firewall or antivirus may be blocking this traffic. Try to temporarily disable your firewall or antivirus and see if the devices start to appear in Dashboard.
- Make sure that Dashboard is using the correct NIC to communicate to your devices. By default, Dashboard will try to automatically choose the correct NIC. If the above two methods didn't help, it's best to tell Dashboard explicitly which NIC to use. Follow this document to update Dashboard with the appropriate NIC: Checking the network settings for Dashboard - TelosHelp (telosalliance.com)
- If not of the above helps, you will need to check the Network Metric of your NIC:
Modify the metric used by the AoIP network card
The “metric” is a cost factor that is assigned to each network device in your system. Windows strives to use the lowest cost connections first. There are many factors that go in deciding what metrics to assign, but in general 1 gig network connections are thought to be better than 100 meg, full duplex is better than half duplex. Connections with a gateway are used before those without, etc. All of these things are factors in considering what “cost” (more accurately Metric) is assigned and a lower cost (Metric) is better.
Consider this: You need to get internet access to check e-mail. You have a cable modem, a cell phone connection, and a dial-up connection ( I know… who has dial-up anymore, but it works for this example ). Your cable modem would have a Metric of 1, your cell phone connection would have a Metric of 2, and the dial-up would be a Metric of 3 so by default it would use the lowest “cost” of 1, so it would use the cable modem.
In the Axia (AoIP) world, we don’t want it to use a “best” one, we want it to use a “specific” one, so we set it manually to the lowest Metric. Everything else in your system will still continue to operate normally.
Before proceeding with this, it's best to verify that there is a problem. To verify, open a command prompt on your PC and type this command:
netsh interface ip show join
After pressing ENTER, you will see this:
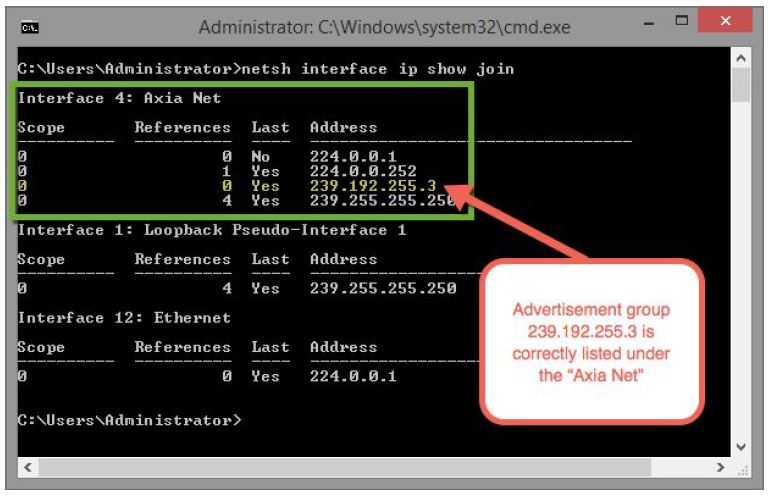
Note that the multicast address of of 239.192.255.3 is correctly listed under the Axia Net (Green box). Axia Net is the same that was given to this particular adapter in Windows. Yours may say something different. If the IP Address of 239.192.255.3 shows up listed under any network adapter other than the Axia network, then you need to proceeed with the following changes. If the IP address of 239.192.255.3 shows up correctly, then you do NOT need to proceed.
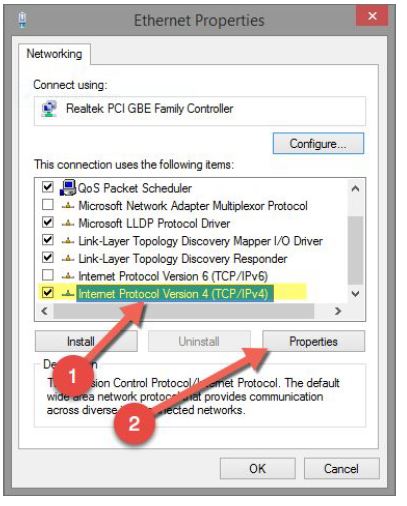
If you have gotten here, then navigate to where your network adapter settings are changed. In Windows, this is generally found by going to Control Panel, select Network and Sharing Center, and then clicking on Change adapter settings. That should list any network cards in your system. Right click on the network adapter used for Axia/AoIP and choose Properties.
- Select Internet Protocol Version 4 as shown below
- Click Properties
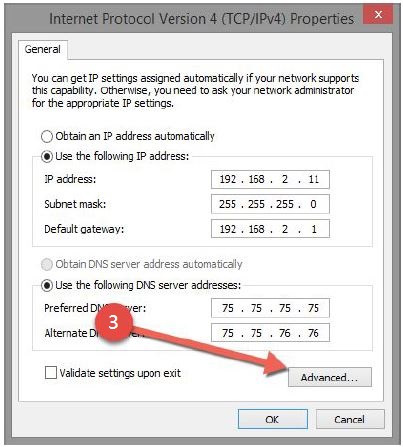
- Then click advanced from the general tab:
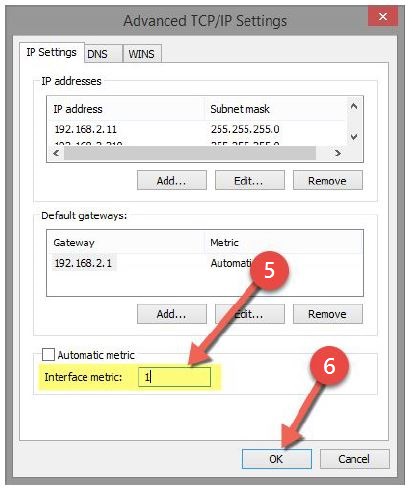
- On the Advanced dialog, uncheck the box next to the Automatic Metric
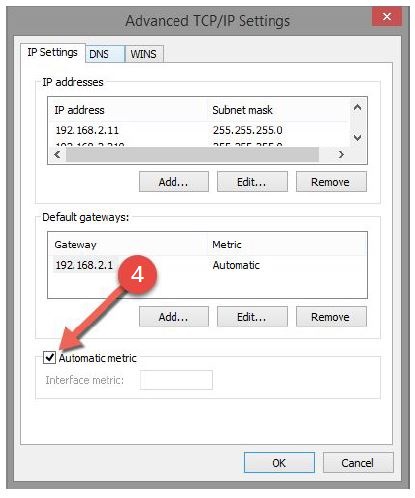
- Key a "1" into the text field
- Click OK
- Click OK on the remaining dialog boxes and then click CLOSE on the Ethernet Properties dialog.
Depending on your application, you may need to restart the entire PC as some software runs as a Windows service rather than an application. Most of the time rebooting is the only way to get it to re-subscribe to the multcast advertisement group. When in doubt, reboot.
How to fix a device that has a red exclamation mark
If you are seeing devices with a red exclamation mark in Dashboard, that means that Dashboard has previously been able to communicate with the device, but has somehow lost connection to it.
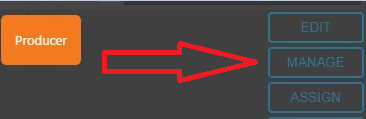
- First, make sure you can reach the device's web interface. This can easily be done through Dashboard. Just click on the device so that it is highlighted, and then click on the Manage button. This will take you to the unit's web interface. If you cannot connect to the web interface of the device, make sure that it is properly connected to the network (check cables, connection to switch, IP address, etc).
- If more than one panel has the red exclamation mark, try to restart Dashboard. See the very bottom of this document for instruction on how to restart Dashboard Server: Checking the network settings for Dashboard - TelosHelp (telosalliance.com)
- If all else fails, try and power cycle the device and see if it comes back.
If during any of these steps you have found that a power cycle of the device brought the unit back in Dashboard, please contact our support department. There may be something else going on with that panel that we may need to investigate.
Let us know how we can help
If you have further questions on this topic or have ideas about improving this document, please contact us.