Diagnosing iQs audio issues
 Updated
by
Bryan Jones
Updated
by
Bryan Jones
Taken from an article written by Greg Shay, March 16, 2021.
Scope
There are multiple variables in the platform product setup that can potentially interact, making understanding what is going on (or going wrong) difficult at times.
By proceeding along these steps, verifying the first steps before attempting the further ones, we will build on each step's state.
Validate real-time task execution latency of the audio DSP process:
On the System Status page, note the DSP task latency max figure from the (min, max) latency figures.
A good value here is less than 150us.
A marginal value is greater than 150us but less than 300us.
A poor value is greater than 300us, and further configuration of the VM platform or CPU execution profile of the host will be required to get adequate audio performance without defects.
If your value is good or marginal, it's ok; proceed to look at the stream statistics.
Display of stream statistics.
Here is a screenshot of example stream statistics:
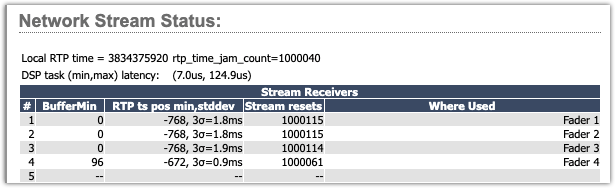
This set of measurements gives meaningful feedback to the user of the input streams, of what is going on, is everything 'normal,' and when something is wrong is the problem with the incoming streams.
BufferMin
BufferMin is represented in audio samples. It's the minimum receive audio buffer remaining, computed at the moment a new packet comes in. Zero is technically ok, but with no margin for any additional network delay. A negative figure is an underflow and means an audio glitch. A typical ‘good’ reading will show a moderate minimum buffer occupancy (48 to 100 samples), but neither too low nor too high.
Values much larger than zero mean excess buffer is being used, causing excess latency.
RTP ts position min, stddev
This is the relative position of the incoming RTP timestamps compared with local RTP time in samples.
Negative means the packet is carrying audio data from the past. A 'normal' RTP ts position in a perfectly operating system would be a negative number equal to the number of samples in the packet.
A positive number is, generally speaking, impossible (you can't send a packet and have it arrive in the future.) In practice, it means there is synchronization error, either in the sending device (the sending device local time clock running fast), or the receiving device (receive device local time clock is running slow), or a combination.
The most negative RTP timestamp position corresponds to the greatest risk of audio buffer underflow (i.e., packets coming in late.) So the minimum is displayed.
The standard deviation (stddev) of the RTP ts is a measure of the time jitter in that stream. The "3 sigma" value corresponds to a 99% confidence probability (under the assumption of gaussian distribution, which may or may not be accurate but is a useful approximation to measure.) In the iQs this computation of sigma uses running averages with time constants of 6 seconds for the average and 3 seconds for the variance.
The sigma reported is the sqrt() of the variance.
Screen updates
The BufferMin and RTP ts pos min are reset each time the read of the statistics is refreshed (about every 3 to 5 seconds in the iQs, which is paced by the JavaScript refresh in the browser.)
Coverage
Every packet is measured. If there is even one rogue late packet, it will show up (if you are looking at the BufferMin and RTP ts pos min figures). It will deviate the stddev, and then decay down with the 6 second time constant, and it will leave a persistent increase in the defect count (until the stream receiver is changed or reloaded.)
Using the statistics information
The idea is, you need to set the AES67 link offset (in the Source Profile) to receive a stream so that the buffer never goes negative. To do this, you need a link offset value that is added to the minimum RTP ts offset to keep that result value positive. And you need a buffer size to hold the offset as well as the jitter.
When you have both sending and receiving devices using AES67 and PTP clock, global time stamps can be used directly, along with the link offset value. Using these PTP time samps directly is called synchronous mode (synchronous means same time).
Syntonous (meaning same tone, or frequency) is what Livewire sync uses. Frequency lock, but no common absolute time reference.
For syntonous receive mode, used when you cannot rely on the RTP timestamps (for instance, Livewire where there are no valid timestamps), the stream receiver automatically picks a stream reference point and starts buffering. The buffer's size is determined by the jitter in the stream so that the buffers don't keep underflowing. In practice, the automatic syntonous receive tends to hunt for and find the latest packets, and start the buffering from there.
Stream Resets
Stream resets counts the number of audio glitches, which usually are caused by buffer underflows. This happens if the link offset is not set high enough, so late packets arrive too late to be used.
In the iQs this counter is cleared when you load a new source into the stream receive channels (the Faders, Vmixers, Monitors, etc.)
If a stream is being received in syntonous mode, this will be indicated in the Stream Defects column number having an offset of 1000000.
This does not mean a high number of errors, the error count is in the lower digits of this number.
In this example, I have different link offsets for the top 3 receivers, which are coming from our in-house Windows-based stream player. You can see the stddev (jitter) is higher for these, and I have a couple of milliseconds of buffering.
The 4th stream is from an xNode, and shows very low (reading 0.0) jitter. As such I could crank down the link offset to the minimum to get minimum latency (for example for mic to headphone loops.)